Wind power generation in Europe
The correlation of renewables in Europe: an example
I am the lead author of a report titled JRC Technical report on the impact of climate variability in the European power systems and released a few days ago. One of the main topics of the report is the co-variability of renewables generation in Europe. You can find many scientific papers on this topic, for example in (Graabak & Korpås, 2016), (Monforti et al., 2016), (Thornton et al., 2017), and in the recent review (Jurasz et al., 2020). Why this topic is so important?
A large amount of renewable power plants makes a power system more vulnerable to weather variations, for example whenever the wind stops blowing suddenly the power system must find another source of electricity to replace the missing electricity coming from the wind turbines. And given that: 1) the European power systems are very interconnected (see the map from ENTSO-E, the network of the European transmission system operators) and 2) sometimes weather events have a large geographical scale, the impact of this event may extend to multiple national power systems, increasing the overall risk exposure.
On the other side, and this is a very interesting point, the weather can be negatively correlated. What does it mean? It may happen that when in, let’s say, Scandinavia there is a lack of wind, somewhere else (often in Spain or in south-east Europe) the wind is instead abundant, and vice versa. And, as we said before, European power systems are interconnected (and they will be more in the future) thus with the possibility to “move” the (possibly clean) electricity wherever needed (a nice visualisation of those flows can be found on the Electricity Map live map).
Using the data from the ENTSO-E Transparency Platform I can try to illustrate this correlation. Let’s consider the onshore wind power generated in two countries with a similar installed capacity: United Kingdom (about 14 GW of capacity) and Italy (slightly less than 11 GW of capacity). Looking at the hourly generation in 2019 we would like to see in each week (168 hourly values) the level of correlation. In other words, we will compute the Spearman correlation on a rolling window of one week to see in each “window” of 168 hourly samples how much UK and Italy’s wind generations are correlated.
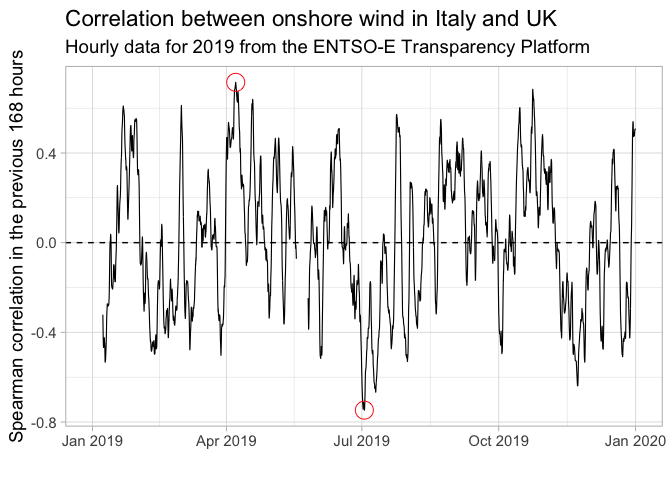
A positive value means that in the previous week the wind generation between the two countries (that are quite far honestly) has a positive correlation (i.e. when the wind is blowing in UK the same is happening in Italy and vice versa). Instead, when a value is negative is because in the previous 168 hours when the wind generated in UK was higher than usual instead in Italy was lower, and vice versa.
We can visualise the generation curves in the period with the highest correlation (0.72, highlighted with a circle), the days between the 31 March and the 7 April 2019.
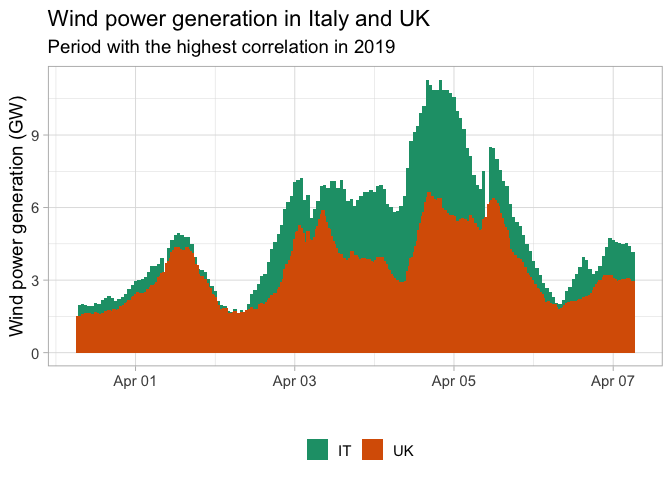
This bar chart shows the hourly generation of the two countries together (unfortunately there are some gaps in the ENTSO-E data). In this period the maximum total generation is 11.3 GW (the evening of the 4 April) but then in 36 hours the wind generation in both the countries went down to 2 GW. In other words, the capacity factor in both the countries went from 45% to the 8%.
Let’s see instead the period with the lowest correlation (-0.75), the days between the 25 June and the 2 July.
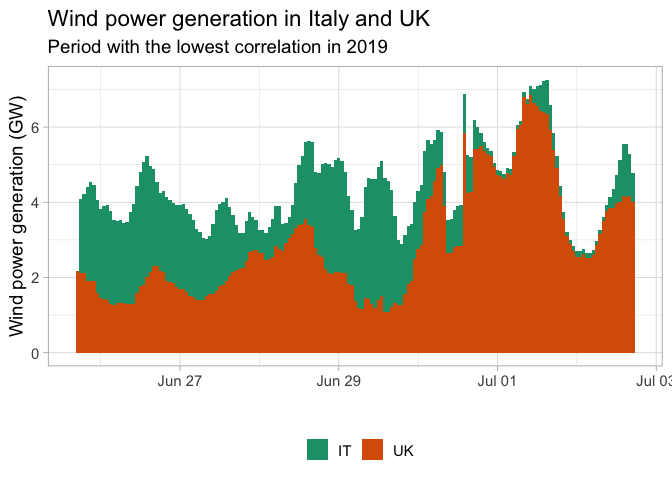
In this chart the situation is rather different. In the morning of the 29 June the wind is scarse in UK (about 1 GW, capacity factor less than 7%) while in Italy is normal (3.6 GW, about 36% of capacity factor). Then the next afternoon we have instead 5.5 GW in UK (40% capacity factor) but 0.2 GW in Italy (0.02% capacity factor!). However, the combined capacity factor varied only slightly, going from 19% to 24%. In this case, the negative correlation had a beneficial effect on the variability which can be measured with the coefficient of variation, the ratio between the standard deviation and the average. In this week, the overall coefficient is 52% for UK and 67% for Italy, but it is instead only 25% for the combined generation: in other words, the overall wind generation is more stable, an important positive feature for a power system.
The choice of Italy and UK is not the most significant for the European power systems but this kind of relationship is visible between many countries as also discussed a bit in the report.
I have also created a stack published on dstack.io where you can explore the correlations between some of the European countries with the highest onshore wind capacity.