Home batteries, PV and dynamic pricing
A small experiment with open model and data
I live in the Netherlands in a terraced house (rijtjeshuis), one of those very common houses where - as far as I can see walking in my neighbourhood - solar panels on the roofs are extremely common.
The electrification of the country is proceeding. Solar panels are everywhere (the country has the most capacity per capita in the world), Electric vehicles are also gaining popularity, accounting for approximately one-third of all car sales). Furthermore, the heat pump market has experienced substantial growth, witnessing a remarkable 57% increase in 2022 compared to the previous year.
Nonetheless, this transition is not without its challenges. In addition to soaring energy prices, grid congestion has emerged as a significant obstacle, leading to considerable solar curtailment and the potential for future power outages.
Therefore, I started wondering what could help to increase the electrification in a sustainable, secure and affordable way. More solar panels? More batteries? EVs? Insulation? Demand response and dynamic pricing of electricity?
Regarding storage, will we have a battery in each house or will we see more vehicle-to-grid?
A bit of modelling
I have decided to try using a power system model to simulate the supply/demand of a group of houses and their interaction with electricity storage, both considering domestic batteries or electric vehicles (vehicle-to-grid).
Here what I assumed:
- Each house with induction stove and the same number of solar panels on the roof
- No electric heating
- Cost of electricity based on dynamic pricing (I have used the Dutch day-ahead price for 2022 adding a 200 EUR/MWh, similarly to what I pay now with my home electricity provider)
The dynamic pricing means that each hour the cost of the electricity taken the grid is linked to the day-ahead price and, at the same time, the surplus of electricity from PV (feed-in) is paid using the same amount.
I prepared five different configurations, simulating ten houses:
-
baseline: no batteries, no EVs -
ev conservative: five EVs are used as shared storage but their charge level cannot go below 90% in any time of the day -
ev flexible: the shared storage of EVs cannot go below 25% -
large battery: five houses with home batteries with 5kW of power and 15 kWh of storage -
small battery: five houses with home batteries with 2.5kW of power and 7.5 kWh of storage
EVs (when modelled) have a mixed usage patterns (daily commuting or shorter trips during the day). The size of the EV batteries is set to 50 kWh.
Data & Models
The first step to prepare this simple study was to obtain realistic electricity demand patterns. I have examined multiple open-source projects (for example this and this) and I have eventually chosen the Artificial load profile generator (ALPG) created by G. Hoogsten at the University of Twente. ALPG is written in Python and it makes possible to simulate the electricity demand of various typologies of households.
The meteorological data, fundamental to calculate solar power production, comes from the Copernicus Climate Change Service (C3S) using this hourly dataset. The solar radiation has been converted to PV production using R package solaR. The modelling was carried out using PyPSA, a widely used open-source power system model.
This small modelling exercise is something I made in a few hours, and it has - obviously - several limitations:
- The modelling assumes a “perfect foresight”, in other words the solutions found by the solver (e.g., using or not the stored electricity in a specific hour) are based on the perfect knowledge of the future (e.g., the cost of electricity in the next hours/days).
- The electricity demand patterns are quite simple and they shouldn’t be considered representative of a realistic household
- The simulations are based on the day-ahead price in 2022, to get some insights into the operations of batteries/PV/EVs it would be necessary to use price time-series for multiple periods
- The usage of EVs is extremely simple, not taking into account any social aspects of using private EVs as electricity storage for the neighbours
- The power system model is used to minimise a cost function which does not include capital costs
Results
Here I want to show the results of this modelling with five different
setups (baseline, ev conservative, ev flexible, large battery,
small battery), each of them consisting of the simulation of ten
houses.
For each configuration, I have explored different values for:
-
season: simulating summer (days between 1st June and 31st August) and winter (1st January-31st March)
-
PV capacity: 1.4 kW or 2.5 kW of installed PV capacity
-
Feed-ins coefficients: how much is paid the electricity injected to the grid: 100% of the current hourly price, 50% or 0 (i.e., no feed-in)
-
Capping: how much electricity can be injected to the grid: 100% of the PV installed capacity, 60% or 20%
Given that the pattern of electricity consumption is an important factor in this simulation, for each configuration I launched 10 simulations, each one with a different combination of household types (see the list in the ALPG README).
On average, the electricity consumption for one house in three months is 572 kWh (given the lack of electric heating, the consumption is similar in winter and summer). The PV instead, generates in average 471 kWh in winter (for 1.4 kW of capacity) and 918 kWh in summer.
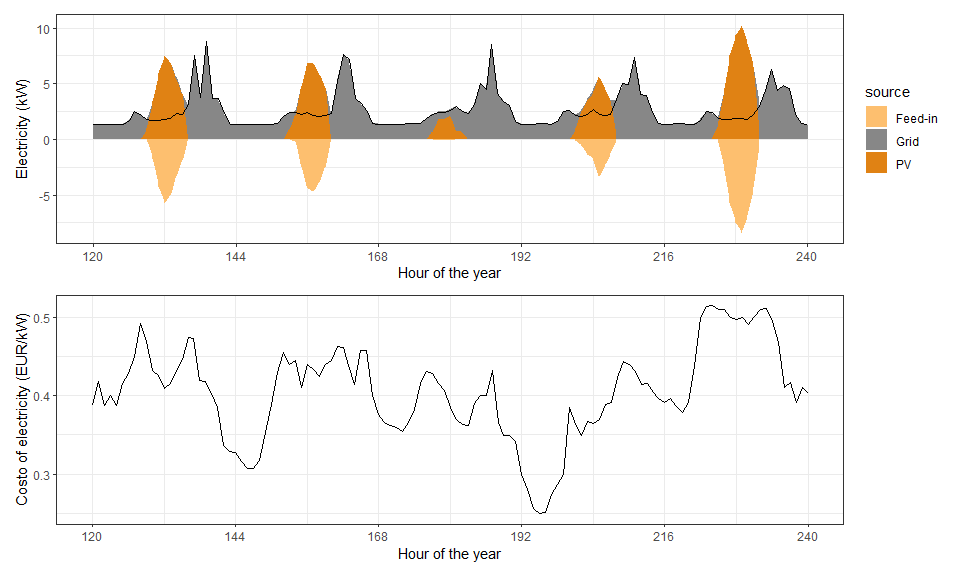
This chart shows an example of what happens (in the baseline setup)
during a few days in winter (first days of January) in the simulated ten
houses (each with 2.5kW of PV). In the top panel, we can see that the PV
generates a surplus of electricity which is injected to the grid (as it
happens now with the current feed-in system, the
teruglevering).
The bottom panel shows the hourly cost of electricity for the
households.
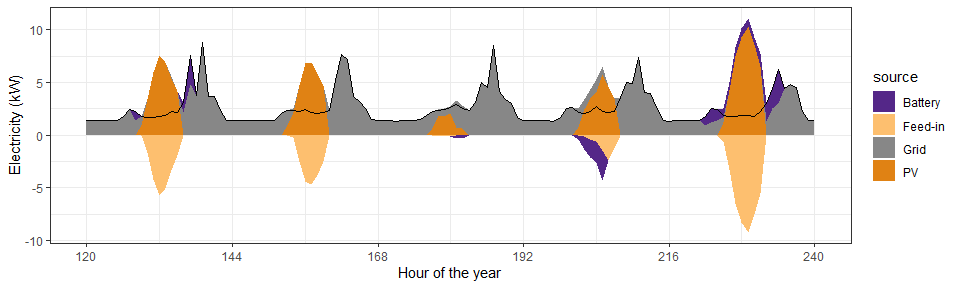 We can see
that adding the battery (
We can see
that adding the battery (small_battery setup), as expected, reduces
the use of electricity from the grid: 252 kWh in the first example and
241 kWh in the second (-4%).
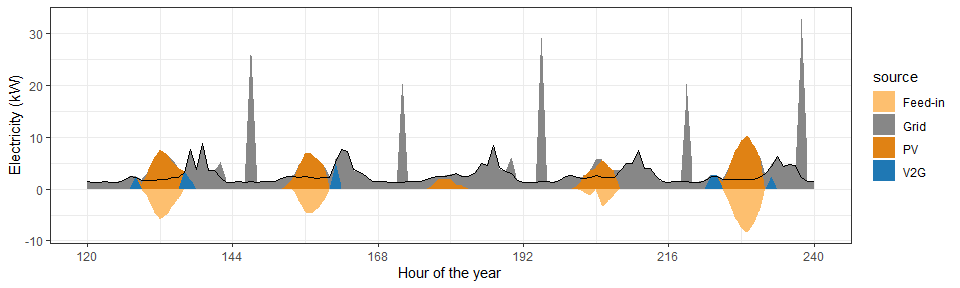
The situation changes when EVs are included in the simulation (this is
the ev conservative setup). We can see the “spikes” caused by the
charging and the use of the car batteries (when not used) as community
storage.
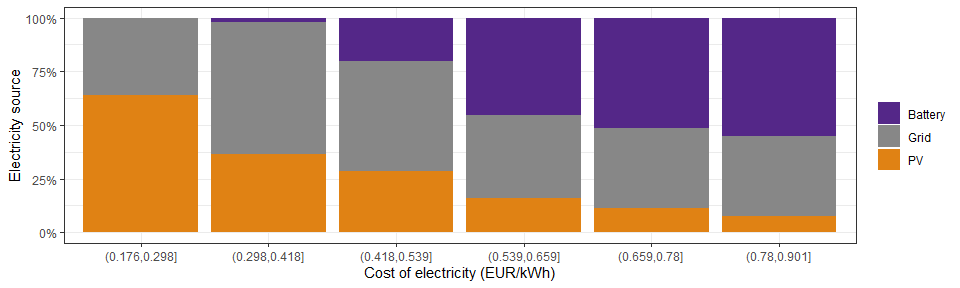
The power system model is based on the optimisation of a cost function, i.e., minimise the cost of operating the entire system. In this example, the cost consists only of the cost of electricity from the grid. This means that the operations of batteries are affected by availability of free electricity (i.e., PV) and by the cost of the electricity from the grid, which is - in turn - affected by the availability of PV energy in the entire national power system.
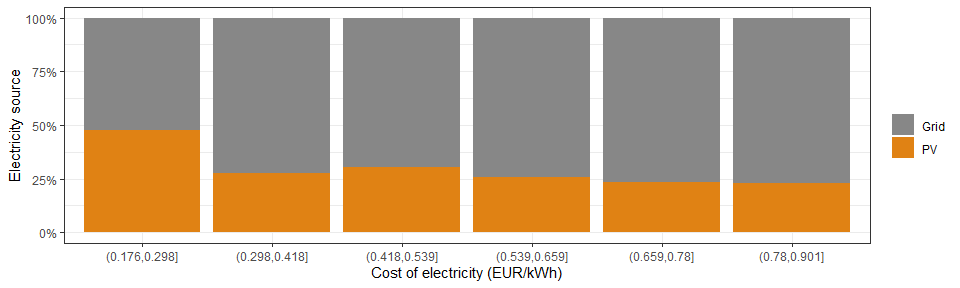 This chart
shows how the electricity is coming from with respect to the hourly
cost, we can see that in general the hourly prices are lower when the PV
is producing more. In the Netherlands the day-ahead cost of electricity
is currently driven by the amount of solar & wind power (basically free
electricity) available in the grid.
This chart
shows how the electricity is coming from with respect to the hourly
cost, we can see that in general the hourly prices are lower when the PV
is producing more. In the Netherlands the day-ahead cost of electricity
is currently driven by the amount of solar & wind power (basically free
electricity) available in the grid.
 This is the
same chart but with a battery (
This is the
same chart but with a battery (small_battery setup), obviously the
battery is used more when the cost of electricity is higher, to reduce
the overall costs (i.e., the battery is filled up when the electricity
is cheap and is discharged when the cost is higher).
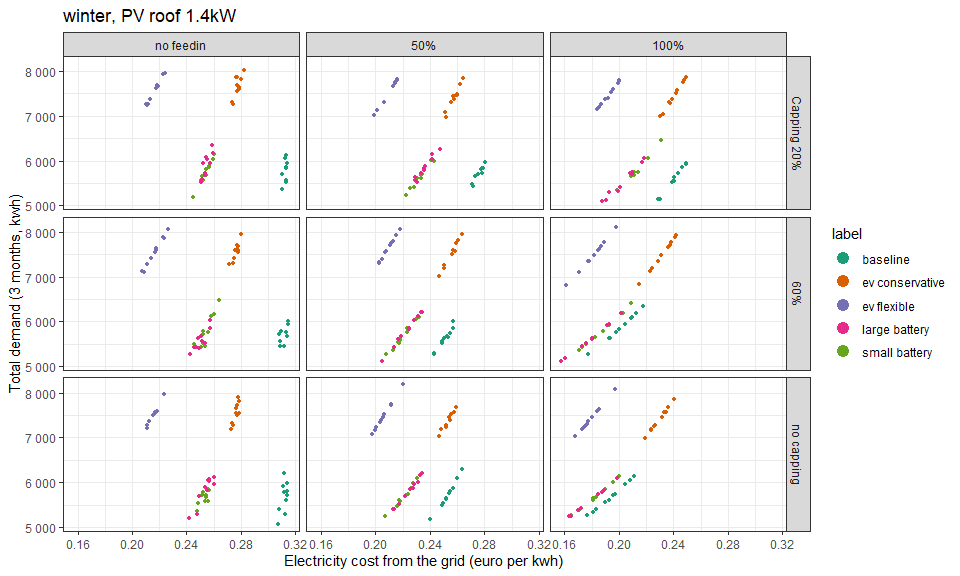
This is a visual summary of the average cost of electricity for each configuration and varying the feed-in coefficient and the capping. The average cost is calculated dividing the total cost (cost for the electricity from the grid minus the money received from the feed-in) by the total demand of electricity. For each configuration, the chart shows the 10 simulations to show the variability and the consistency of the results.
The model suggests that when there is the feed-in, the presence of home batteries leads to lower costs. As expected, the highest cost comes with the presence of EVs with a conservative use of their batteries as storage, due to the higher overall demand. When the feed-in is not present (i.e., the surplus of electricity from PV is not remunerated), the EVs with a flexible use of their batteries shows the lower costs, due to their batteries larger than a common home battery. Actually, in the ev_flexible configuration we have 5 EVs each with a storage of 50 kWh that can be managed as residential storage when the charge is above the 25%. In the large_battery instead, we have 5 home batteries each with 15 kWh of capacity.
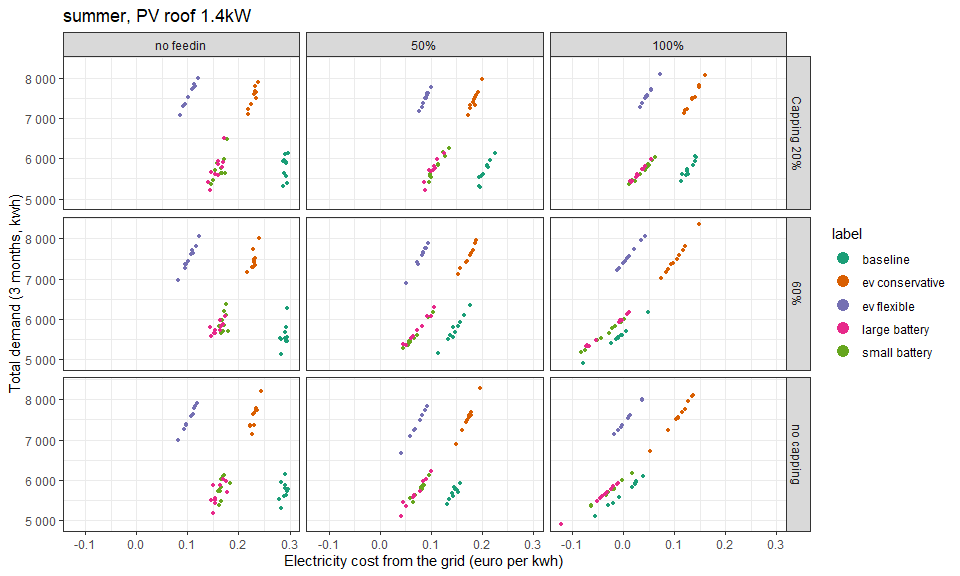
This shows the same summary but during the summer season, when there is more PV production.
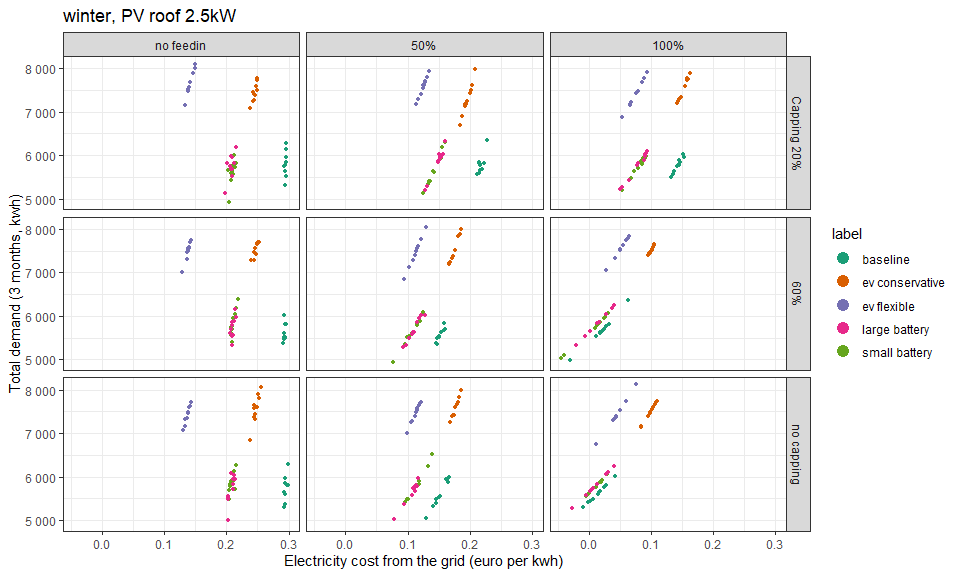
Winter with more PV panels (2.5 kW).
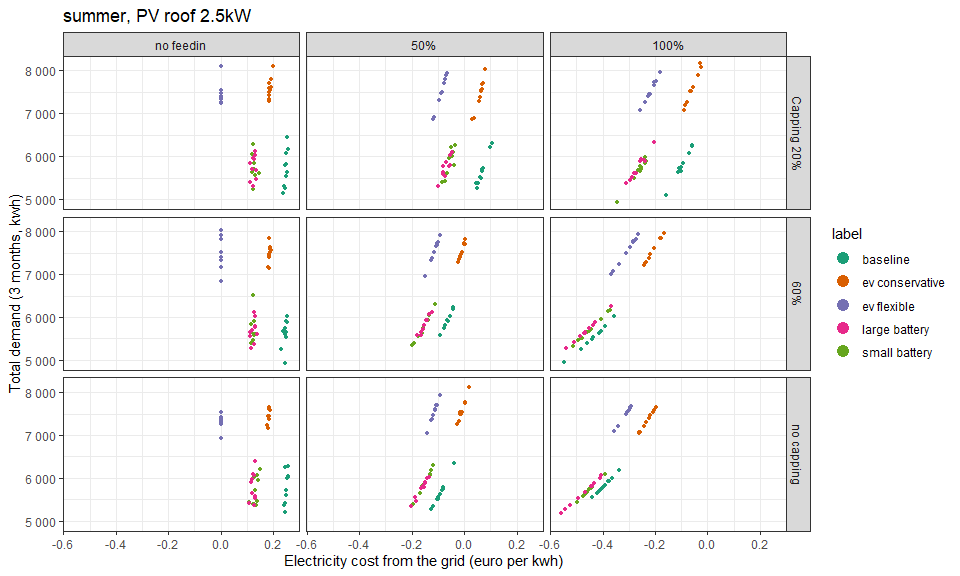
Summer with more PV panels (2.5 kW)