Open modelling of European power systems with Python
A proof-of-concept in a notebook
I have recently published a Python notebook illustrating how to create a model for all the European power systems using only open data and tools.
Basically, selecting a list of countries and a period (for example from 1st January 2021 to 1st February 2021), the code creates the inputs needed for the PyPSA open source model to simulate the hourly behaviour of the European power systems, based on the data from ENTSO-E (for electricity generation, infrastructure) and from Copernicus Climate Change Service (C3S) for the meteorological-derived variables (e.g., wind capacity factors).
This notebook can be seen as a proof-of-concept and some of its limitations are listed in the README page of the repository.
This modelling approach has the advantage of being based 100% on open tools and data but, at the same time, it is too simple to be able to capture the complex behaviour of actual power systems. However, the code may be useful to learn how power system works, to reproduce some large-scale events happened in the past, to do some simple what-if scenarios.
I want to show here a brief comparison between the European (28 countries) electricity generation in May 2021 from the ENTSO-E Transparency Platform data and the simulation results.
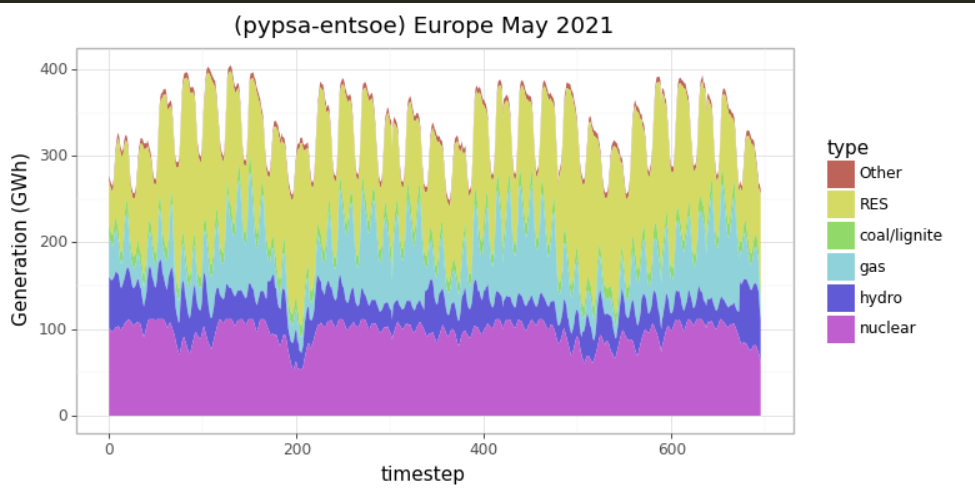
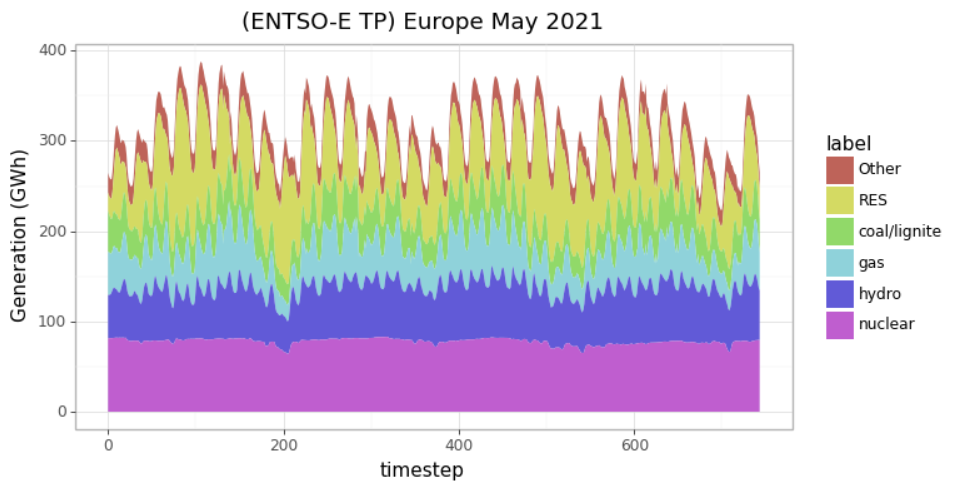
As you can probably see, some differences are quite evident:
- Nuclear generation in the model is too flexible, with much more ramping to accomodate the availability of wind and solar
- Hydropower in the model seems too conservative probably due to the lack of realistic flow constraints (e.g., ecological flows) and storage
- Coal/lignite and gas are very different: this is due to the production costs defined in the model that are totally different from the real ones
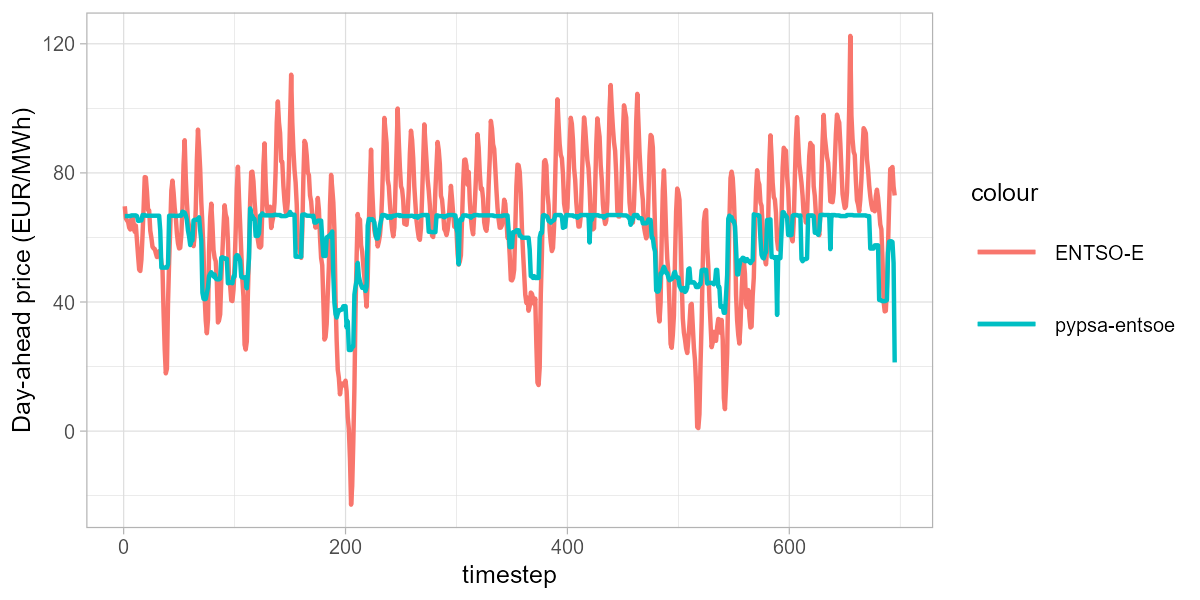
However, renewable sources (RES) seem to match rather well and - in general - the two “shapes” are very similar. The degree of similarity between the model and the actual data is summarised in the following chart, showing the total day-ahead price (calculated as average weighted by the demand) curves. Obviously, the model is not able to capture the daily variability or the negative prices, but at least is able to capture a part of the variability due to the availability of wind power.
I think in the future I will continue to improve the model and I will try to analyse how the model is able to capture the cross-border flows or how it can be used for simple what-if scenarios. If you want to contribute, to comment or to report a bug, you can visit the repository or drop me a message.